Four Workspaces to Build, Test, and Monitor
A focused look at the SFZ screens traders actually use every day: creator, backtesting, terminal, and analytics.
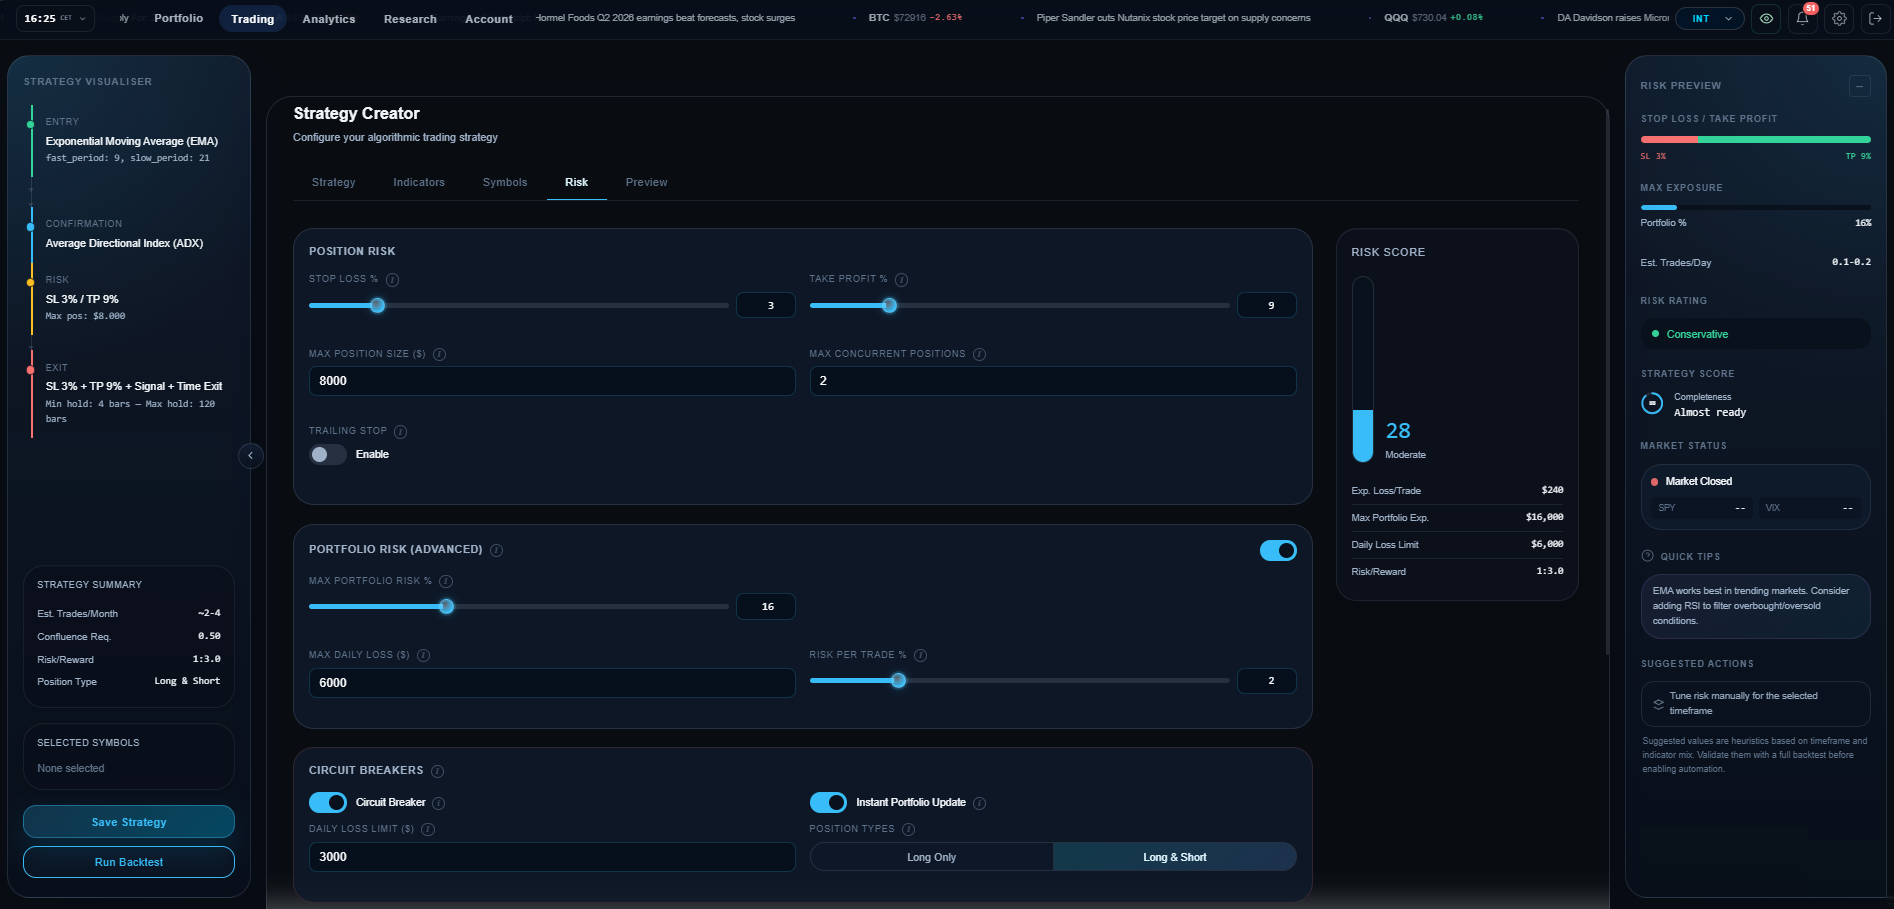 Creator
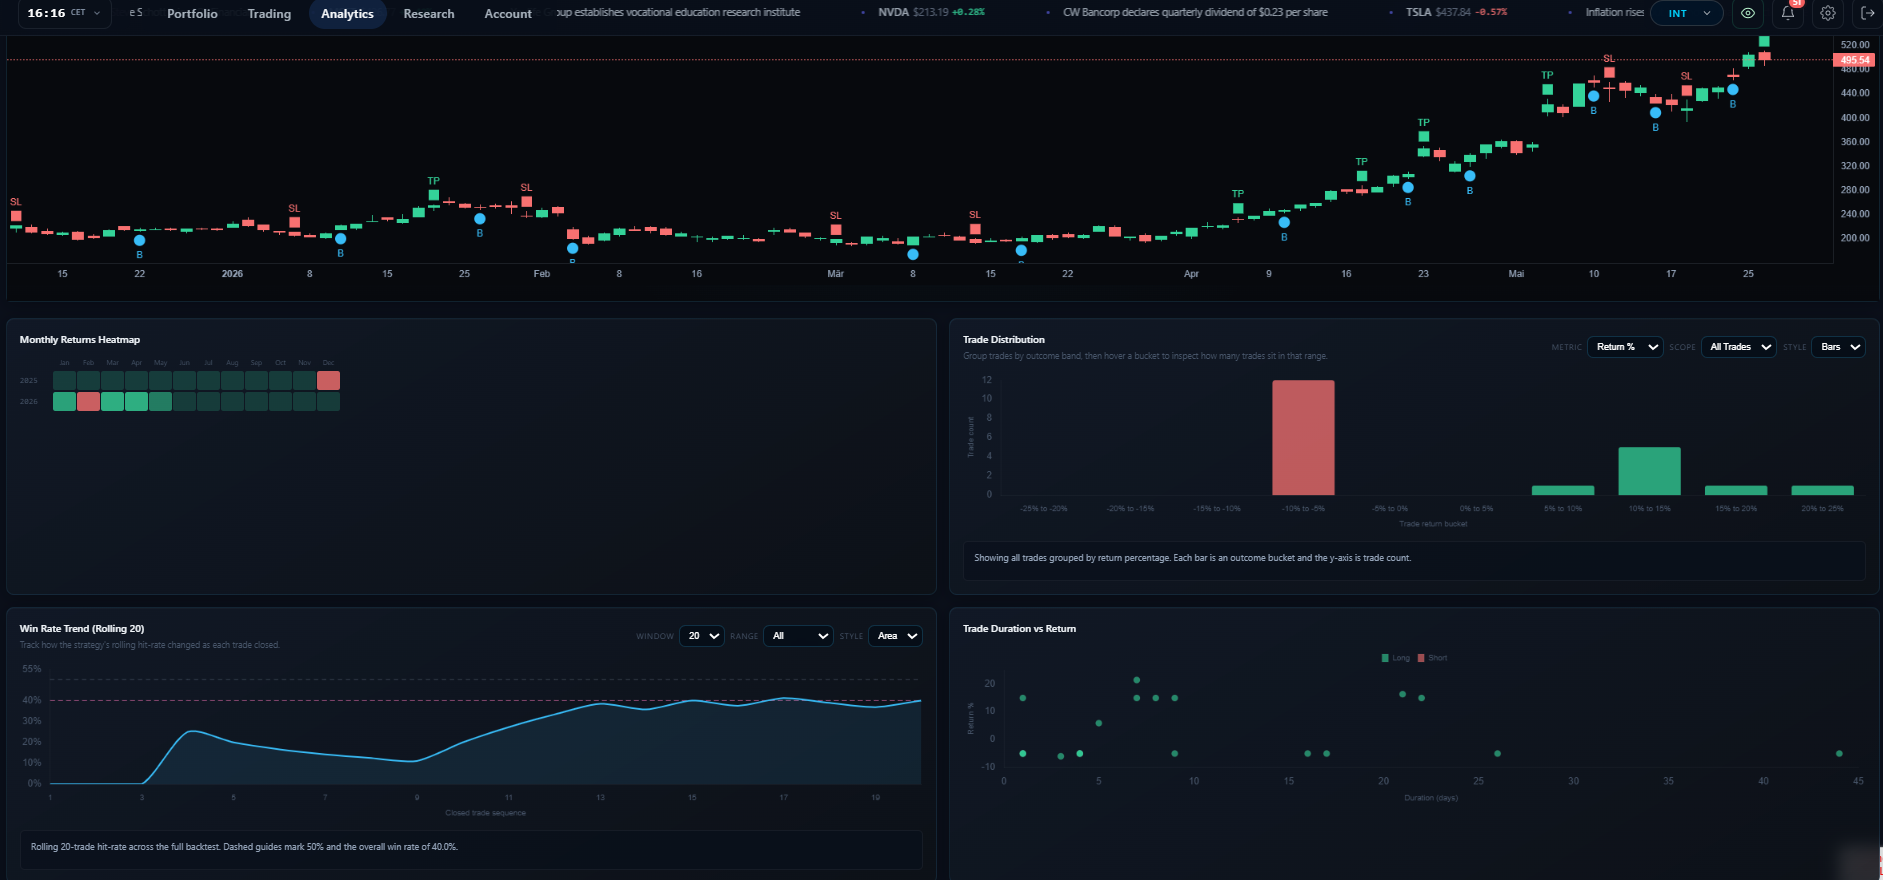 Backtesting
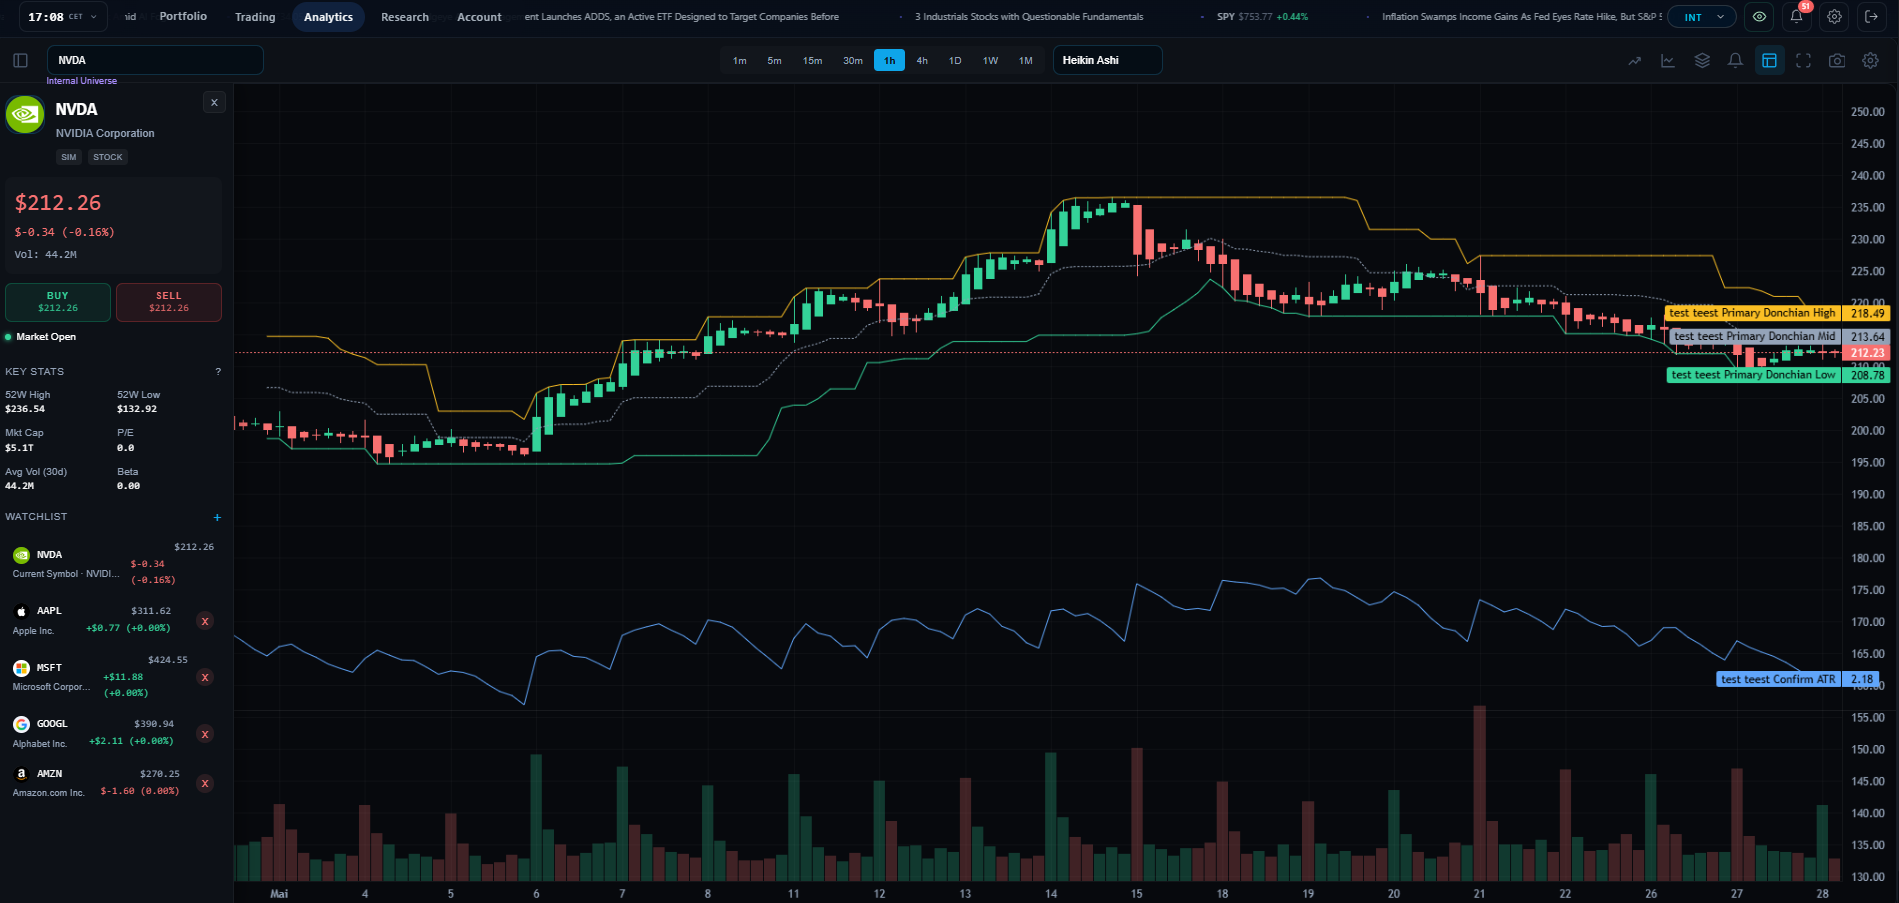 Terminal
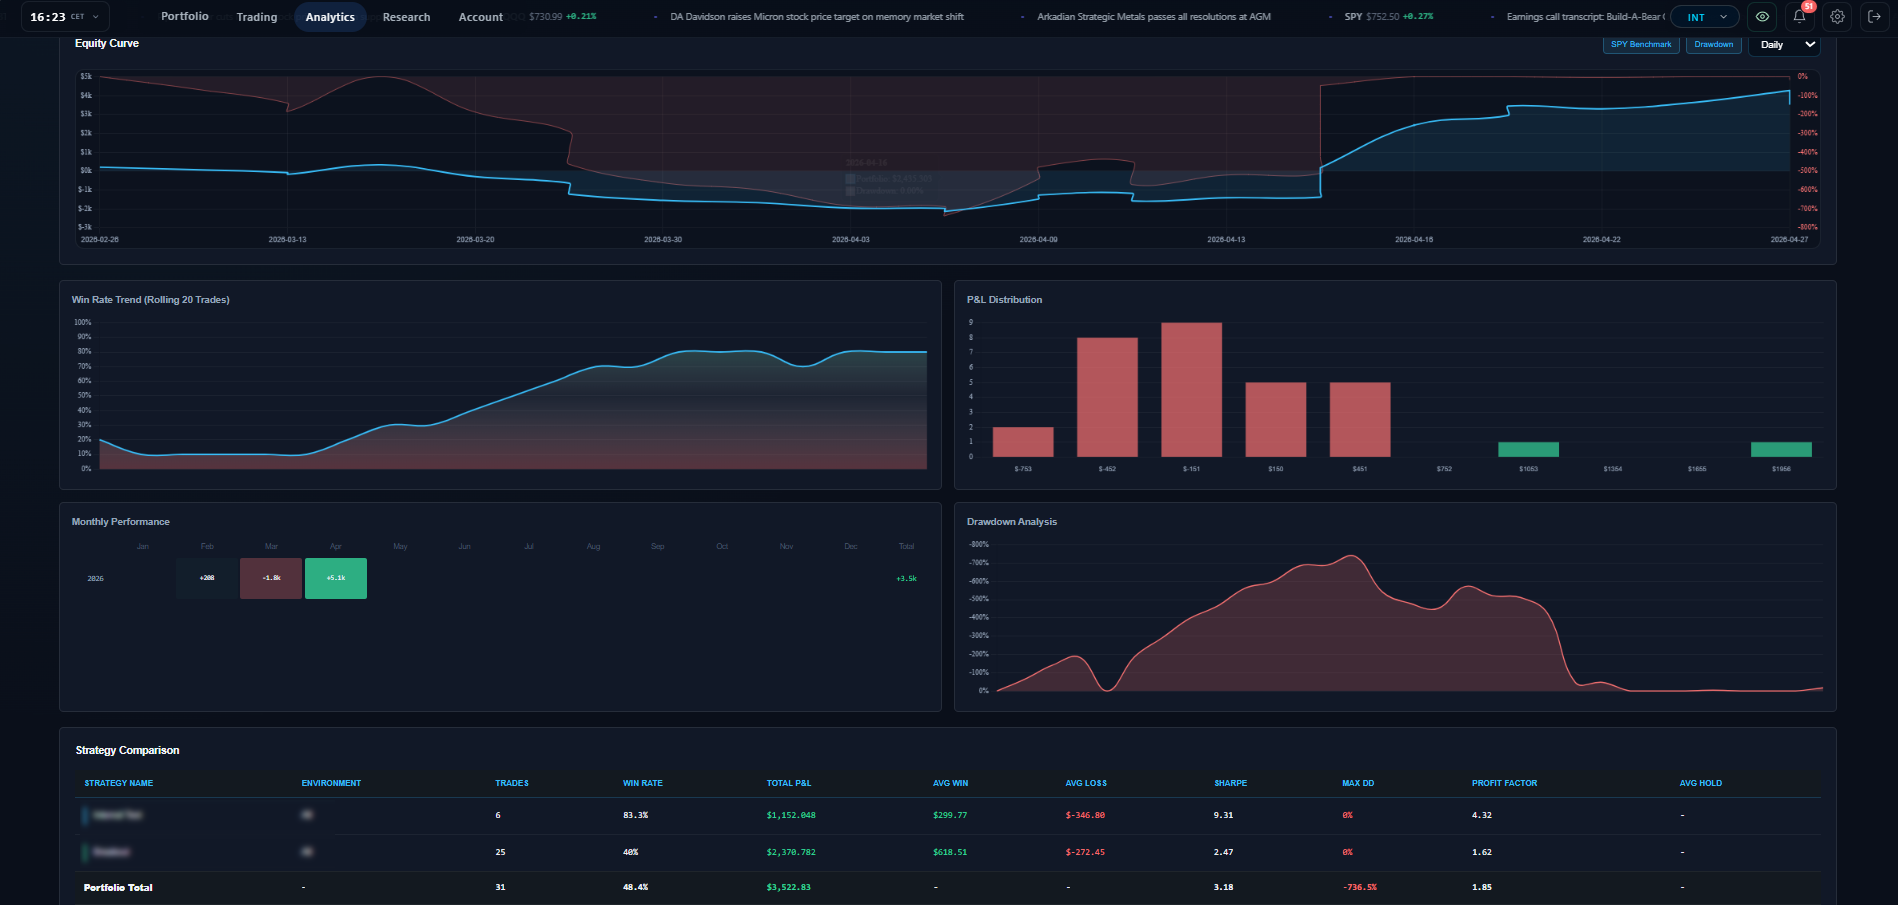 Analytics