

Analytics Workspace
Performance you can actually interrogate.
The same analytics layer runs through every backtest, the portfolio and the dedicated analytics page. Risk-adjusted ratios, PnL distributions, drawdown profiles and trade-level attribution — enough to tell a good strategy from a lucky one.
Three surfaces, one engine
Analytics follow the strategy everywhere it goes.
You should not have to export a CSV to find out how something performed. The same metrics appear wherever a strategy has produced results.
On backtests
Every historical run comes back with a full statistical profile, not just an equity curve and a return figure.
In the portfolio
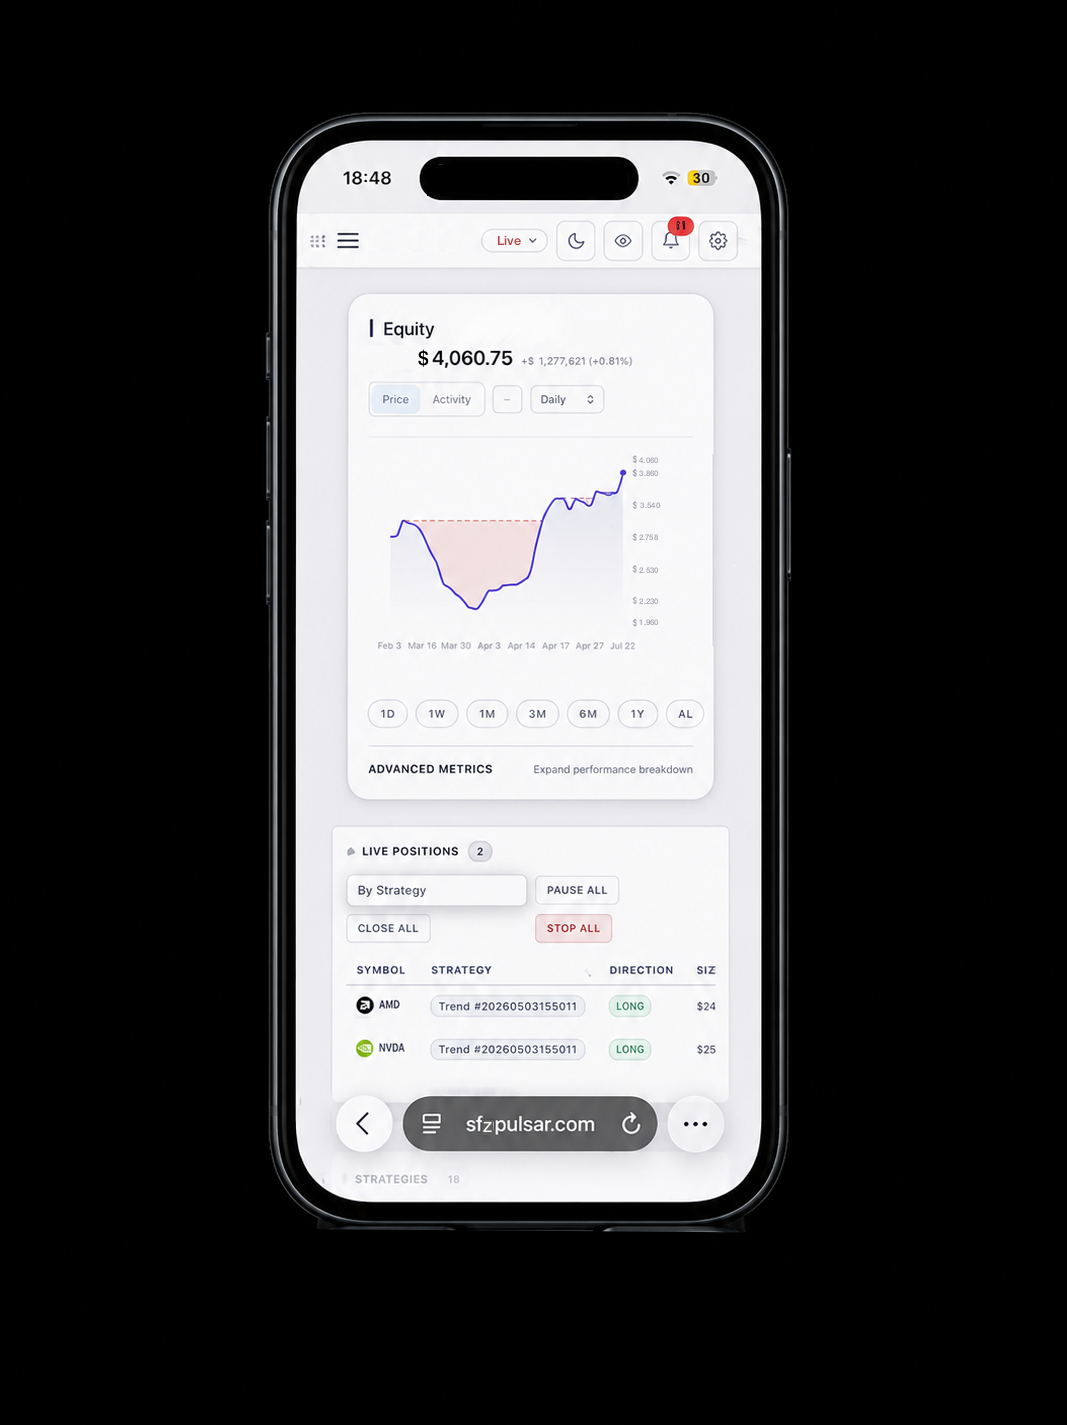
Live and paper results are measured the same way, so deployed behaviour is directly comparable to the backtest that justified it.
On the analytics page
A dedicated workspace for cross-strategy comparison, where you look at the whole book rather than one run at a time.
What you get back
Metrics that survive scrutiny.
Headline return is the least informative number in trading. These are the measures that tell you whether a result is repeatable, how it was earned, and what it cost in risk.
- Risk-adjusted ratios that price the return against the volatility and drawdown it required.
- PnL distribution bucketed by outcome band, exposing outlier dependence an average would hide.
- Drawdown profile — depth, duration and recovery, not just the worst number.
- Hit rate and expectancy alongside average win and average loss magnitude.
- Exposure and hold time, so you know how long capital was actually committed.
- Attribution by symbol and strategy, separating a working system from one instrument that ran.
From measurement to change
Optimization that closes the loop.
Analytics are only worth the time if they change what you do next. Everything measured here points back at a setting you can adjust in the Strategy Creator.
01 — DIAGNOSE
Find the stage that is leaking
Signal generation, entry conversion and exit quality are measured separately, so a weak result points at a specific stage instead of a vague verdict on the whole strategy.
02 — COMPARE
Hold variants against each other
Run the same rule set with different parameters over the same window and compare the statistical profiles rather than the returns alone.
03 — ADJUST
Change one thing at a time
Every metric maps to a configurable field. Tighten a stop, widen a filter, cap concurrency — then re-run and see what actually moved.
04 — MONITOR
Watch for drift after deployment
Because live results use the same metrics as the backtest, a strategy that stops behaving like its historical profile is visible early rather than after the damage.
Related
Where these numbers come from.
Backtesting Engine
The historical runs that produce most of what the analytics workspace measures.
Explore backtestingPortfolio & Live Trading
Live and paper performance, measured with exactly the same instruments.
Explore the portfolioStrategy Creator
The settings every one of these metrics ultimately points back at.
Explore the builderMeasure what your strategies actually do.
Pulsar is in closed beta. Create an account, or tell us what you are trying to build.
Backtested and simulated results are hypothetical and are not indicative of future results.