

Chart Analysis
Charts that show your strategy, not just the price.
A full charting workspace in the style you already know — drawing tools, stacked indicator panes, custom timeframes — with your own strategies plotted directly onto the series, and manual order entry when you want to take the trade yourself.
The charting workspace
Familiar tools, connected to your automation.
Most charting packages are read-only islands. This one shares its data, its indicators and its strategies with the rest of the platform, so what you see on the chart is what the engine trades.
01 — SERIES
Price the way you read it
Candles, line and area series across the timeframes you work in, with a full crosshair readout of open, high, low, close and volume for any bar you inspect.
- Multiple series types and timeframes
- OHLC and volume readout on hover
- Dark and light chart themes
02 — DRAWING
Annotate what you see
Trendlines, rectangles, ellipses, rays, horizontal levels and text — the drawing set you expect, saved with the chart so your analysis survives a reload.
- Trendlines, shapes, rays and levels
- Text annotations
- Persistent per-symbol drawings
03 — INDICATORS
Stack the measurements that matter
Add indicators to the price pane or into their own sub-panes, each with configurable parameters and its own level lines — the same indicator library your strategies use.
- Overlay and sub-pane indicators
- Configurable parameters and level lines
- Shared with the Strategy Creator
04 — STRATEGY OVERLAYS
Your logic, drawn on the series
Project a strategy onto the chart and watch its signals, confirmations and levels appear in context. It is the fastest way to understand why a rule set fired when it did.
- Signal and confirmation markers in place
- Strategy levels plotted with the price
- Multiple strategies on one chart
05 — MANUAL TRADING
Take the trade yourself
Not every decision should be automated. Place and manage orders directly from the chart, alongside whatever your deployed strategies are doing in the same account.
- Order entry from the chart
- Manual and automated positions side by side
- Straight into the portfolio view
06 — CONTEXT
Company data next to the tape
Fundamentals and instrument metrics sit under the chart, so you can check what you are actually trading without opening another tab.
- Company data and key metrics
- Symbol search across your universe
- Snapshot and share the view
On any screen
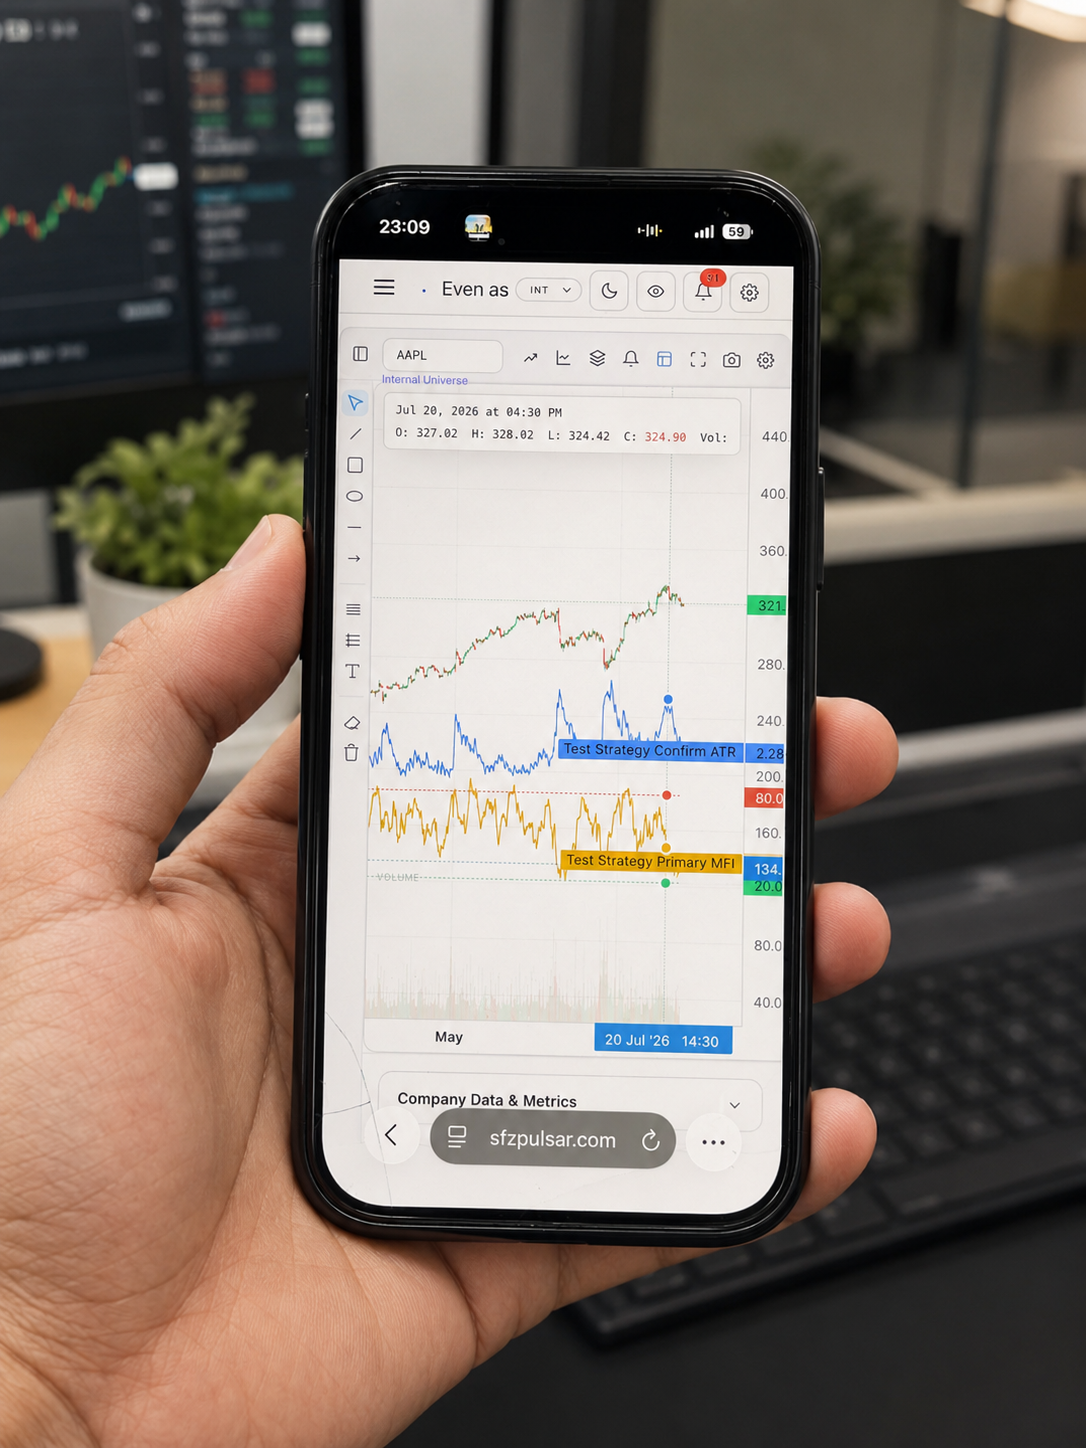
The same chart in your pocket.
The charting workspace is built for the browser, so a phone gets the real thing — indicator panes, strategy overlays and the crosshair readout included, not a stripped-down viewer.
- Full drawing toolbar on touch, not a cut-down subset.
- Strategy overlays travel with you — the same signals you configured on desktop.
- Check a position anywhere without installing anything.
Next in the workflow
Turn what you see into something systematic.
Strategy Creator
Encode the setup you keep drawing by hand into rules that run on their own.
Explore the builderBacktesting Engine
Find out whether the pattern you spotted held up across years of history.
Explore backtestingPortfolio & Live Trading
Watch manual and automated positions settle into the same account view.
Explore the portfolioSee your strategies on the chart.
Pulsar is in closed beta. Create an account, or tell us what you are trying to build.
Trading involves substantial risk of loss. Past and simulated performance are not indicative of future results.